March 9, 2026
Staf Corporation
FOR IMMEDIATE RELEASE
Calendar Year 2025 Greenhouse Gas (GHG) Emissions: 33.6 t‑CO₂e
— SBT 1.5°C Target Achieved —
Despite a 12.5% increase in headcount and a high-cooling-demand summer, heat-reflective coating on outdoor AC units showed encouraging improvement in cooling energy consumption
📌 Three Key Highlights
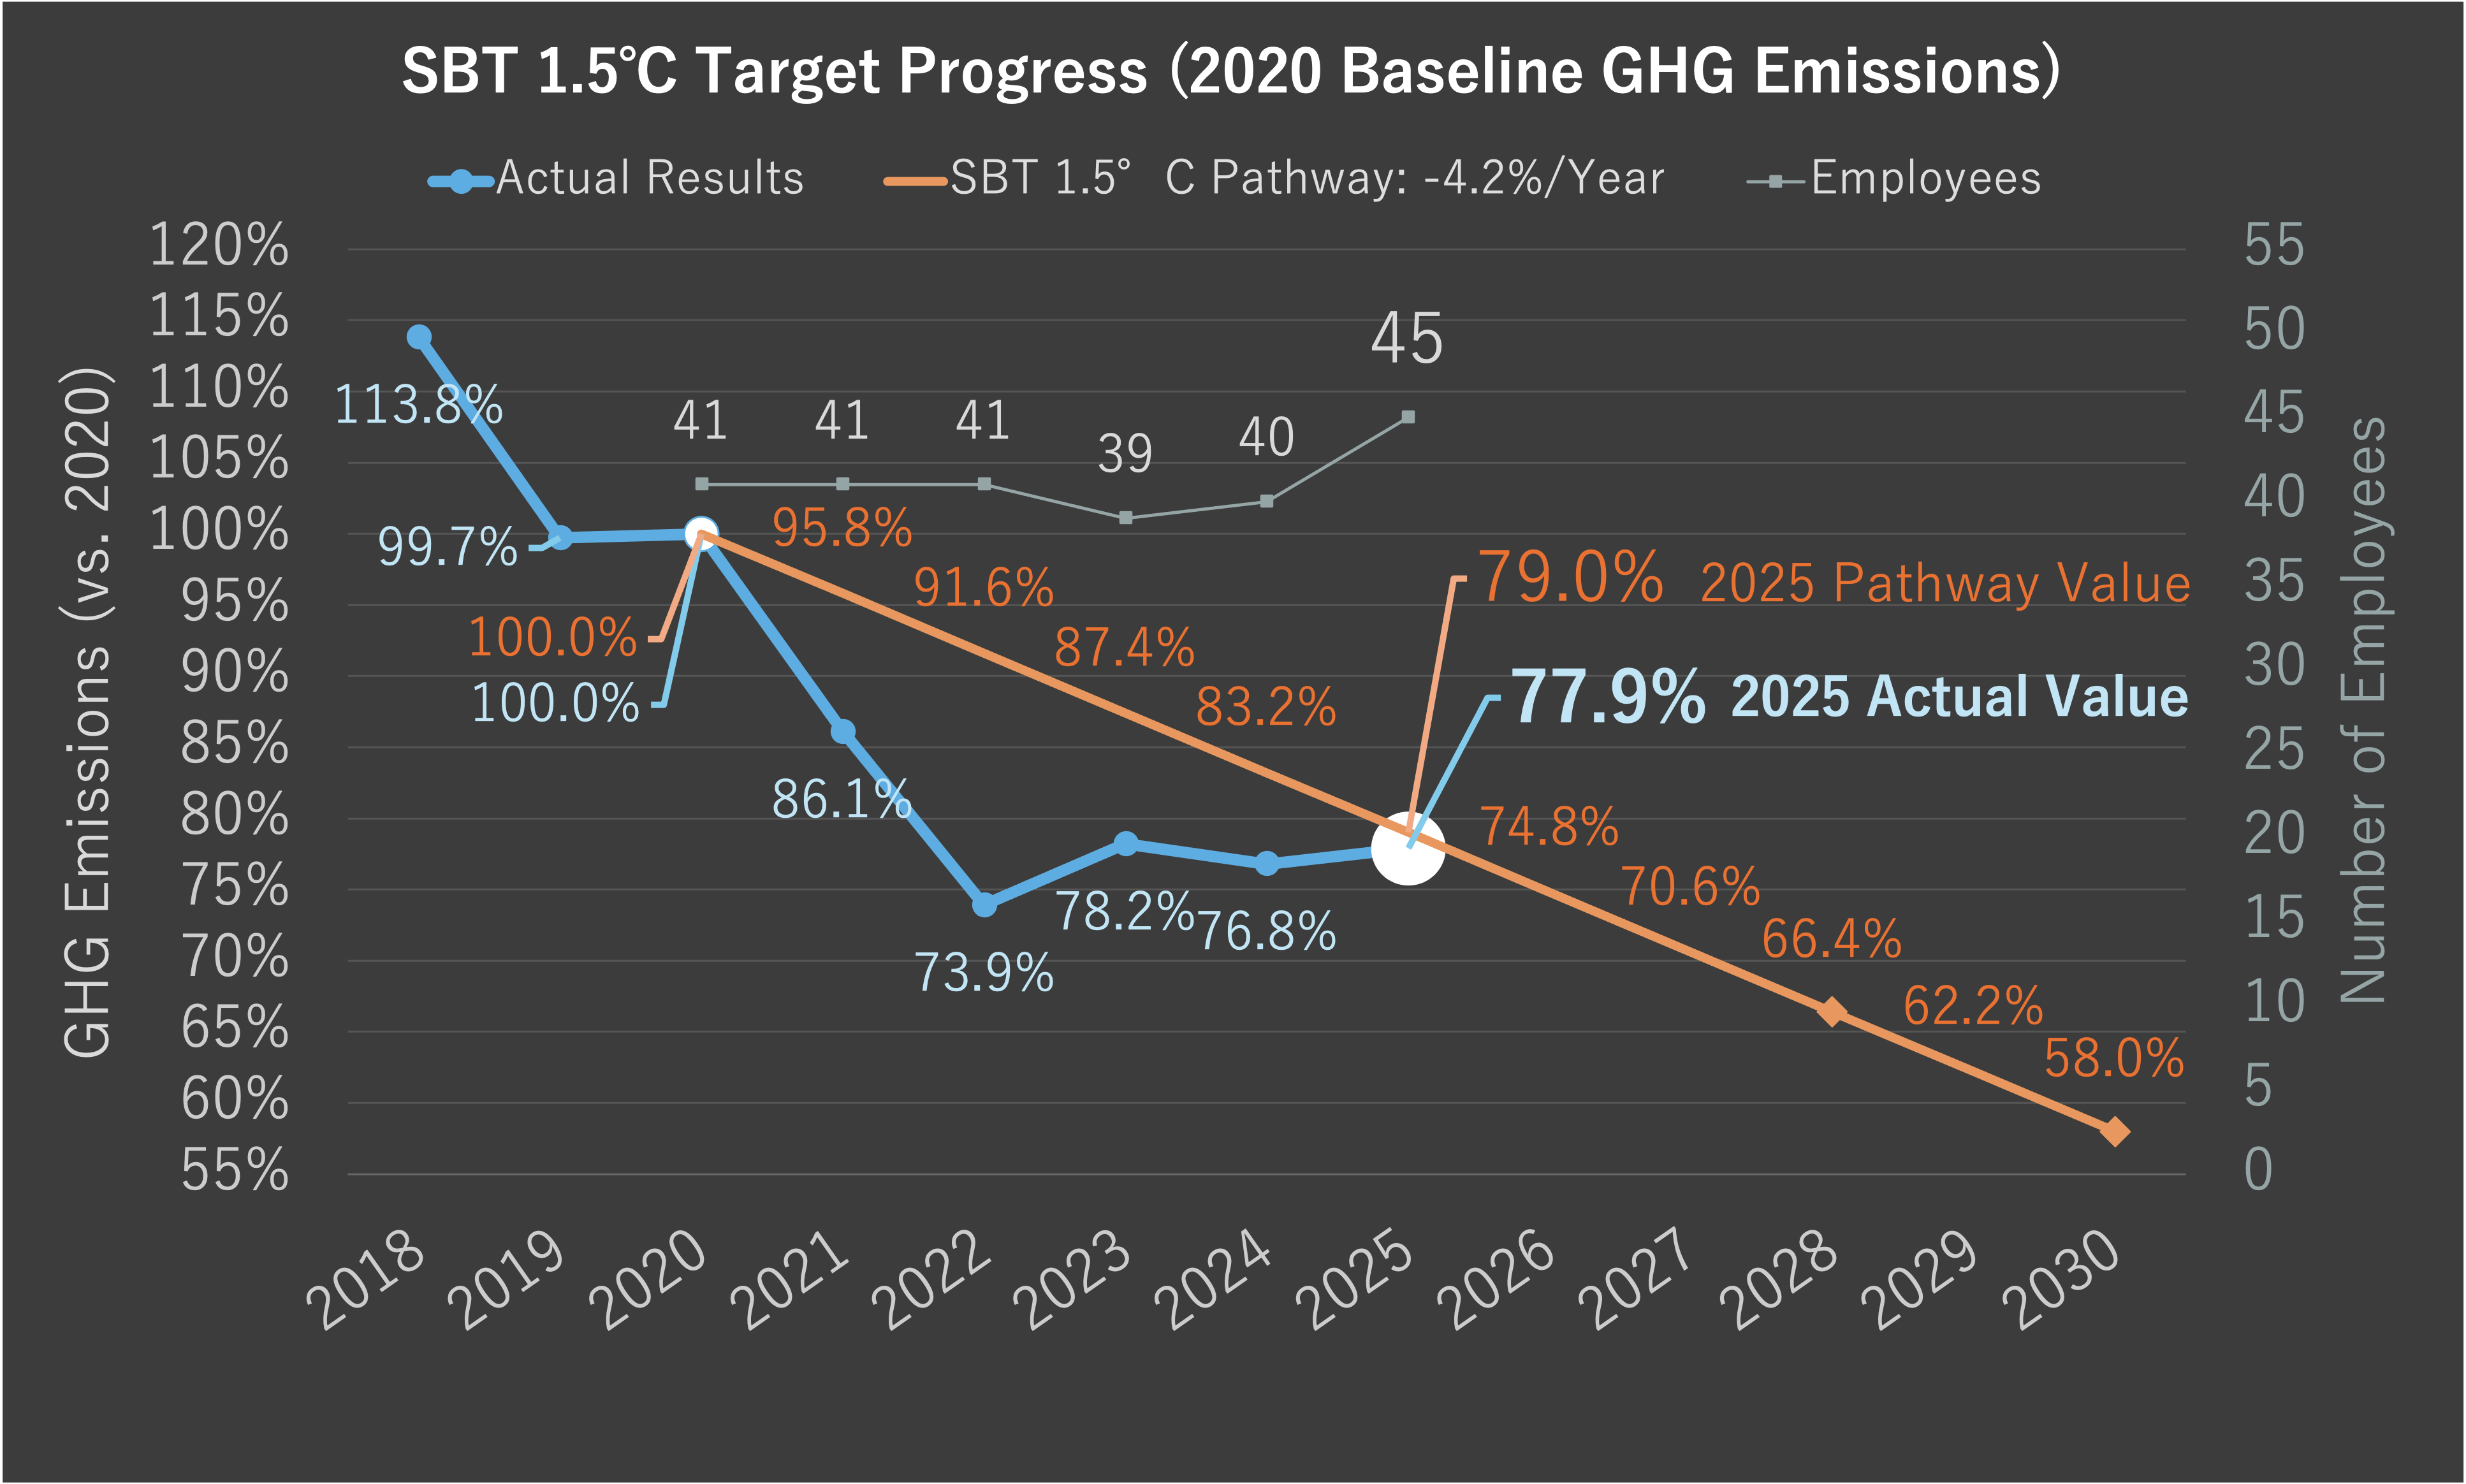
| ① | GHG emissions totaled 33.6 t‑CO₂e. Against the SBT 1.5°C pathway target of 79.0% relative to the base year, our actual result was 77.9% — target achieved. |
| ② | Headcount grew by 5 employees to 45, yet despite a summer with above-average cooling demand, per-capita GHG emissions improved 9.9% year over year (0.747 t‑CO₂e). |
| ③ | A comparative analysis of heat-reflective coating applied to outdoor AC units — benchmarked against uncoated units within the same building — suggests an additional cooling-season energy improvement of approximately 3–4% (estimated savings of approx. 1 MWh). |
The company achieved a 22.1% reduction from its 2020 base year. Against the 2025 interim benchmark of 79.0% (relative to the base year) under our SBT 1.5°C target, actual performance came in at 77.9%, meeting the target.
In addition, a comparative analysis of the heat-reflective coating (Macnica Cut®) applied to outdoor AC units in April 2025 — benchmarked against uncoated units within the same building — suggests additional energy improvement during the cooling season.
* "Macnica Cut®" is a registered trademark of Macnica, Inc.
📖 Glossary
GHG (Greenhouse Gas): A collective term for gases that contribute to global warming. Carbon dioxide (CO₂) is the most common example.
Scope 1: Direct CO₂ emissions from fuel combustion at the company's own facilities (e.g., gasoline for company vehicles). Staf Corporation has maintained zero Scope 1 emissions since 2023.
Scope 2: Indirect CO₂ emissions from purchased electricity. This category accounts for virtually all of the company's GHG emissions.
SBT 1.5°C: Science Based Targets — an international standard requiring corporate emission reductions consistent with limiting global temperature rise to 1.5°C above pre-industrial levels.
t‑CO₂e: Metric tons of CO₂ equivalent — a standardized unit for measuring greenhouse gas emissions.
CDD₂₂ (Cooling Degree Days): The cumulative value of daily mean temperatures exceeding 22°C, used as an indicator of cooling demand.
Shoulder season: The transitional periods between the cooling and heating seasons (April–May and October–November), when HVAC demand is relatively low.
Macnica Cut®: A heat-reflective and insulating coating applied to outdoor AC units. It reduces air conditioning energy consumption by reflecting solar heat and providing thermal insulation.
1. Calendar Year 2025 GHG Emission Highlights
| Item | 2025 | 2024 | YoY Change |
|---|---|---|---|
| GHG Emissions (Scope 1 + 2) | 33.6 t‑CO₂e | 33.2 t‑CO₂e | +1.4% |
| Ratio to Base Year (2020) | 77.9% | 76.8% | +1.1 pp |
| SBT 1.5°C Pathway Target | 79.0% | 83.2% | — |
| Margin vs. Target | ▲1.1 pp (Achieved) | ▲6.4 pp (Achieved) | — |
| Scope 1 | 0.00 t‑CO₂e | 0.00 t‑CO₂e | — |
| Scope 2 (Electricity) | 33.6 t‑CO₂e | 33.2 t‑CO₂e | +1.4% |
| Annual Electricity Consumption | 79,486 kWh | 78,406 kWh | +1.4% |
| Emission Factor | 0.000423 t‑CO₂/kWh | 0.000423 t‑CO₂/kWh | — |
| Headcount* | 45 | 40 | +12.5% |
| GHG Emissions per Capita | 0.747 t‑CO₂e | 0.829 t‑CO₂e | ▲9.9% |
* Headcount includes executives and is as of July 1.
2. SBT 1.5°C Target Achievement
Staf Corporation has set a target to reduce GHG emissions (Scope 1 + 2) by at least 42% from the 2020 base year by 2030, in line with the SBT 1.5°C pathway. The corresponding interim benchmark for 2025 is 79.0% of the base year level.
Actual emissions for calendar year 2025 came in at 33.6 t‑CO₂e, or 77.9% of the base year (43.2 t‑CO₂e), outperforming the target by 1.1 percentage points. Despite headcount increasing from 40 to 45 (a 12.5% rise), per-capita emissions improved to 0.747 t‑CO₂e — a 9.9% year-over-year reduction.
Scope 1 emissions have been reduced to virtually zero and maintained at zero since 2023. As nearly all emissions fall under Scope 2 (electricity), managing electricity consumption remains the top priority.
3. Background and Conditions for 2025
The summer months (June–August) of 2025 saw sustained above-average temperatures according to Yokohama Local Meteorological Observatory data, resulting in elevated cooling demand. Month-over-month average temperature differences compared to the prior year were: June +1.6°C, July −0.6°C, August +0.2°C, and September −0.3°C.
CDD₂₂ (Cooling Degree Days, base temperature 22°C) averaged +2.36°C above the prior year for June–August, and the 2025 annual CDD₂₂ total reached 643.7 — the highest in the past eight years (vs. 617.1 in 2024). This indicates conditions that were particularly conducive to higher cooling electricity consumption.
Given these challenging conditions and a larger workforce of 45 employees, keeping GHG emissions within the target is attributable to the combined effect of day-to-day energy conservation practices and the heat-reflective coating initiative.
4. Heat-Reflective Coating: Effectiveness Analysis
🌿 Key Findings on Heat-Reflective Coating
| Primary Result | An additional energy improvement of approximately 3–4% during the cooling season was observed. |
| Estimated Savings | Approx. 1 MWh (equivalent to 0.3–0.4 t‑CO₂e) |
| Sensitivity Analysis | An internal comparison (coated floors 3F/4F/6F vs. uncoated floors 5F/8F) showed a 11.4% relative improvement. However, this figure is unadjusted for occupancy levels and floor usage, and should be interpreted as an upper-bound estimate. |
In April 2025, Macnica Cut® (a heat-reflective and insulating coating) was applied to the outdoor AC units at our office building. The coating was applied to units serving the 3rd, 4th, and 6th floors, while the 5th and 8th floors were left uncoated as a control group.
4‑1. Methodology
To estimate the coating's effectiveness, we compared electricity consumption between coated and uncoated floors within the same building. We calculated the rate of change in electricity use for both groups across two periods — pre-application (shoulder season: April–May) and post-application (cooling season: June–September) — and extracted the incremental effect of the coating through a difference-in-differences (DiD) approach.
Note that differences in occupancy levels and floor usage (e.g., presence of meeting rooms) between floors could not be fully controlled for, so the results should be viewed as a conservative estimate. Shoulder-season data (October–November) was also incorporated to minimize the influence of seasonal variation.
4‑2. Results
| Analytical Method | Result | Interpretation |
|---|---|---|
| DiD Analysis (Coated vs. Uncoated, Cooling Season) | Approx. 3–4% | Conservative estimate |
| Estimated Energy Savings | Approx. 1 MWh | Equivalent to 0.3–0.4 t‑CO₂e |
| Sensitivity Analysis (Internal Floor Comparison, Unadjusted) | 11.4% | Unadjusted relative improvement (upper-bound estimate) |
| Upper-Bound Savings Estimate | Approx. 3 MWh | Equivalent to approx. 1.3 t‑CO₂e |
* For reference: A pre/post comparison showed a 9.1% change for coated floors and 5.8% for uncoated floors. However, since these figures include floor-specific condition differences, they were not adopted as the primary result. The sensitivity analysis figure of 11.4% represents the differential between coated floors (3F/4F/6F) and uncoated floors (5F/8F) and is unadjusted for occupancy and floor usage.
* Estimated savings range: 0.8–1.2 MWh (equivalent to 0.3–0.5 t‑CO₂e). The approximate midpoint of 1 MWh is used as the representative value in this release.
4‑3. Discussion and Limitations
The observed additional energy improvement of approximately 3–4% during the cooling season is believed to have contributed to meeting the emission target despite the high cooling demand of the 2025 summer. However, these findings are based on a single season of data, and floor-level differences in occupancy and equipment conditions could not be fully controlled. We plan to conduct a more robust evaluation using two seasons of data once 2026 summer results become available.
5. Outlook — Toward Our 2030 Target
The SBT 1.5°C pathway requires reaching 58.0% of the base year level (a 42% reduction) by 2030. Staf Corporation will continue and strengthen the following initiatives to achieve this goal.
① Managing Growth-Related Increases: As business expansion drives headcount growth, we will continue operational improvements aimed at sustaining the downward trend in per-capita emissions.
② Monitoring Emission Factor Trends: Since changes in the electricity provider's emission factor directly impact our Scope 2 emissions, we are also considering electricity plans with a higher share of renewable energy.
6. GHG Emissions: Annual Trends (2018–2025)
| Year | Electricity (kWh) |
Emission Factor (t‑CO₂/kWh) |
Scope 1 (t‑CO₂e) |
Scope 2 (t‑CO₂e) |
Total (t‑CO₂e) |
vs. Base Year | SBT Pathway | Headcount | Per Capita (t‑CO₂e) |
|---|---|---|---|---|---|---|---|---|---|
| 2018 | 80,058 | 0.000462 | 0.45 | 36.99 | 37.44 | — | — | 39 | 0.960 |
| 2019 | 78,498 | 0.000457 | 0.17 | 35.87 | 36.04 | — | — | 38 | 0.949 |
| 2020 (Base Year) | 89,940 | 0.000480 | 0.14 | 43.17 | 43.31 | 100.0% | 100.0% | 41 | 1.056 |
| 2021 | 85,498 | 0.000457 | 0.14 | 39.07 | 39.21 | 90.5% | 95.8% | 40 | 0.980 |
| 2022 | 81,860 | 0.000459 | 0.07 | 37.57 | 37.64 | 86.9% | 91.6% | 40 | 0.941 |
| 2023 | 77,498 | 0.000434 | 0.00 | 33.64 | 33.64 | 77.7% | 87.4% | 40 | 0.841 |
| 2024 | 78,406 | 0.000423 | 0.00 | 33.17 | 33.17 | 76.6% | 83.2% | 40 | 0.829 |
| 2025 | 79,486 | 0.000423 | 0.00 | 33.62 | 33.62 | 77.9% | 79.0% | 45 | 0.747 |
* Scope 2 emission factors are based on TEPCO Energy Partner's actual emission factors for each year. The 2025 figure provisionally uses the same factor as 2024 (0.000423 t‑CO₂/kWh) and will be updated once the official figure is published.
* The base year (2020) total emissions of 43.31 t‑CO₂e include 43.17 t‑CO₂e from Scope 2. The SBT pathway ratio is calculated on a Scope 1 + 2 basis.
* The 33.6 t‑CO₂e figure cited in the body text is the rounded value of 33.62.
7. SBT 1.5°C Pathway (2020–2030)
| Year | SBT Pathway (vs. Base Year) | Actual (vs. Base Year) | Achieved |
|---|---|---|---|
| 2020 (Base Year) | 100.0% | 100.0% | — |
| 2021 | 95.8% | 90.5% | ✔ |
| 2022 | 91.6% | 86.9% | ✔ |
| 2023 | 87.4% | 77.7% | ✔ |
| 2024 | 83.2% | 76.6% | ✔ |
| 2025 | 79.0% | 77.9% | ✔ |
| 2026 | 74.8% | — | — |
| 2027 | 70.6% | — | — |
| 2028 | 66.4% | — | — |
| 2029 | 62.2% | — | — |
| 2030 (Target Year) | 58.0% | — | — |
* The pathway is linearly interpolated from 100% (base year 2020) to 58.0% (42% reduction) in 2030, representing an annual decline of approximately 4.2 percentage points.
📎 Related Links
Macnica Cut® Product Information (Macnica, Inc.)
Yokohama Local Meteorological Observatory — Monthly Temperature Data (JMA)
Media inquiries: Staf Corporation — TEL +81-45-471-1371
© 2026 STAF Corporation. All rights reserved.